Free ECG app · No account · No cloud

A cardiac lab that fits
in a chest strap.

A phone app that records and coaches in the moment, and a desktop dashboard that dissects every session afterward — full ECG, PQRST annotation, 99 graded health metrics, and live arrhythmia detection. All from one chest strap costing about £70. The app is free. See all 99 health metrics ↓

A feature set this complete — you won't find it anywhere.
No subscription. Not here, not anywhere.
Your data doesn't go anywhere.
Get the free app → Why I built this
What You Need

Three things. That's it.

No subscription, no account, no cloud, no ads. Just a chest strap, a phone, and if you want the deep dive web dashboard, something with a browser.

Android Phone

Any Android phone running Android 8 or later. The app records ECG from the chest strap and serves the dashboard over Wi-Fi. Free to install.

Polar H10 Chest Strap

A Polar H10 ECG chest strap (costing about £70). Already own one? You're done paying. Available from Polar or Amazon. The same strap used by cardiac researchers worldwide.

PC, Tablet, or Chromebook

Any device with a browser on the same Wi-Fi as your phone. The dashboard opens in Chrome or Edge — no install needed. A one-time £8 licence unlocks full analysis.

AFib DETECTED 130Hz · LIVE ECG · BEAT-TO-BEAT
Free, forever

Live arrhythmia detection, every beat.

8 arrhythmias classified per R-R interval, on-device — no cloud, no averaging.

130Hz raw ECG 8 arrhythmias
  • AFib — 5+ irregular R-R intervals, no repeating pattern
  • Ventricular Tachycardia — flagged as a medical priority
  • Bigeminy, trigeminy, sinus pauses, bradycardia, ectopics

Person lying down wearing headphones and a Polar H10 chest strap, golden sound waves rippling through 3D space around their head
Free, forever

Physiology-driven soundscapes & biofeedback.

A practice, not a measurement — worth downloading for this alone.

  • Resonance — a shimmer that blooms only when your heart & breath synchronise, in 3 training levels
  • Breath Shepherd — meets your real breathing rate, then gently leads it toward calm
  • Heartbeat sonification — your pulse becomes the instrument + per-session coherence & breath metrics
48.2 ml/kg/min · AVG OF 2 METHODS PROTOCOL STAGES Stage 1 · Warm-up Stage 2 · Steady-state Stage 3 · Recovery HEART RATE ZONE 142 bpm WALKING PROTOCOL · 2 METHODS CROSS-VALIDATED
Free, forever

Guided VO₂ Max test, walked from your phone.

Lab-grade fitness test — normally a breathing mask or a £500 smartwatch.

  • Walking / Running / Auto protocol with stage timer
  • Two cross-validated methods — HR/VO₂ extrapolation & Karvonen %HRR
  • Every input & both formulas exported — fully auditable
APNEA HR BR 23:0001:0003:0005:0006:0007:00 AHI ESTIMATE 12.4 · MODERATE NOCTURNAL · ACC + EDR FUSION · OVERNIGHT
Free, forever

Sleep & respiratory, from one chest strap.

What happens to your heart while you're not watching.

  • Nocturnal cardiac monitoring — sleep RMSSD/SDNN/SD2 + HR dipping %
  • AHI estimation with None / Mild / Moderate / Severe classification
  • Breathing rate from ACC + EDR fusion, with confidence score
CLINICAL REPORT · IPM-26.09.03.14.22 ECG · LEAD II METRIC VALUE GRADE Mean HR72 bpm A RMSSD38.2 ms B VO₂ Max48.2 C AHI Estimate12.4 D SDNN52.1 ms A LF/HF Ratio2.1 B + 110 more → Export CSV Export PDF 99 HEALTH METRICS · 15 CATEGORIES · A/B/C/D TRUST GRADES

Clinical reports — CSV & PDF export.

A report you can take to your doctor, file, or share with a coach.

99 metrics 15 categories
  • Full ECG with PQRST annotation
  • 99 graded health metrics with A/B/C/D trust grades
  • One-time £8 — not a recurring tier
H10 POLAR H10 · ~£70 PHONE DESKTOP NO ACCOUNT · NO CLOUD · YOUR DATA
Free, forever

One sensor costing about £70. Fully yours.

Raw 130Hz ECG + 3-axis accelerometer in parallel — and every byte stays on your device.

  • No account, no cloud — data never leaves your phone unless you export it
  • One strap feeds phone HUD, live charts & background models simultaneously
  • Raw data export always included — CSV & PDF, free in the app
Detected in real time, on-device

Your heart, watched every single beat.

Most wearables average your heart rate over 5–10 second windows — smoothing away the exact beat-to-beat variability that reveals a problem. The Polar H10 streams every R-R interval; the app classifies each one as it arrives.

◈

AFib

Atrial Fibrillation — 5+ consecutive irregular R-R intervals with no repeating pattern.

◈

Bigeminy

Every normal beat followed by a premature one — alternating N-V-N-V pattern.

◈

Trigeminy

Two normal beats followed by a premature one — N-N-V repeating pattern.

◈

Ventricular Tachycardia

Rapid, wide-complex ventricular rhythm. Flagged immediately as a medical priority.

◈

Sinus Pauses

Gaps between beats longer than expected — often a compensatory pause after an ectopic.

◈

Bradycardia

Sustained low heart rate outside expected resting bounds.

◈

Sleep Apnea Events

Breathing pauses inferred overnight from HRV and heart-rate patterns.

◈

Ectopics (PVC/PAC)

Premature ventricular/atrial contractions — the most common "flutter" people feel.

Under The Hood

How one heartbeat becomes a classification.

Every R-peak is cleaned, anchored inside a 1-second window and checked against its neighbours' timing before the neural network ever sees it — on-device, in real time.

1 Raw ECG Signal Polar H10 · 130 Hz raw µV stream 2 Preprocessing • Band-pass 1–40 Hz • Per-beat z-score cleaned signal 3 R-Peak Detection Pan-Tompkins · refractory detected R-peak 4 RR Timing Gate • Prematurity vs local RR • Compensatory pause only flagged beats → AI 5 Beat Window 130 samples · 1.0 s 43 before · 87 after R Detailed view — one heartbeat window R-peak anchored · exactly what the CNN sees R P-wave QRS complex T-wave 43 samples · before R 87 samples · after R 130 samples · 1.0 s @ 130 Hz From window to verdict Segmented beat · 130 CNN runs only on RR-flagged candidate beats — not every beat 1D-CNN · TFLite Normal PVC PAC argmax ≥ 60% — otherwise stays 'Ectopic' INPUT FOR THE 1D-CNN 1-D sequence of 130 time-steps x₁ x₂ x₃ x₄ ··· x₁₃₀ RR gate: timing rules decide which beats reach the model — RR intervals are gating rules, not CNN inputs PROCESSING INFORMATION Sampling rate · 130 Hz Window · 130 samples (1.0 s) Anchor · R-peak @ sample 43 Normalisation · per-beat z-score Classes · Normal / PVC / PAC Inference · on-device, real time CNN trained on MIT-BIH (resampled 360 → 130 Hz) · AgeV4
The Health Metrics Engine

99 health metrics. 15 categories.
Every single one graded, not guessed.

Competitors give you one proprietary "readiness score" and hide the math. Your Rhythm Studio shows every metric it computes, grouped by category — and tells you exactly how much to trust each one.

Heart Rate HRV HRV TimeHRV Poincaré HRV FrequencyHR Intensity Spot MeasuresRhythm Events ArrhythmiaHR Zones Training LoadRespiratory Meditation Sleep VO2 Max
A
Direct measurement

Exact inputs, validated formula. Trust the absolute value.

B
Validated estimation

Backed by published research, but an estimation nonetheless.

C
Trend-reliable only

Track the direction over time — don't anchor to the absolute number.

D
Experimental

Emerging methods, disclosed honestly rather than dressed up as fact.

Guided VO2 Max Test

A lab-grade fitness test, walked entirely from your phone.

Set a walking or running protocol, dial in treadmill speed and incline, and the app times the steady-state stage for you — live-tracking heart rate and auto-capturing the mean HR of the final 60 seconds.

VO2max is then estimated two independent ways and cross-validated:

Method 1 — HR/VO2 extrapolation Line through (restingHR, 3.5) and (steadyHR, ACSM_VO2), extrapolated to age-predicted HRmax
Method 2 — Karvonen %HRR VO2max = ACSM_VO2 ÷ ((steadyHR − restingHR) / (maxHR − restingHR))

This is normally done in an exercise-physiology lab with a breathing mask, or estimated as a black box by a £500 smartwatch. Here, every input and both formulas are exported with the result — fully auditable.

48.2
ml/kg/min · average of 2 methods
  • Protocol: Walking / Running / Auto
  • Speed & incline entered from the treadmill console
  • Steady-state HR auto-captured over final 60s
  • Target HR zone coaching cue built in
HRV, Every Domain

Time domain. Frequency domain. Poincaré. Geometric. All four.

Most consumer apps show you one number — RMSSD, maybe SDNN. Your Rhythm Studio computes the full clinical HRV toolkit from the same recording.

Time Domain

SDNN, RMSSD, pNN50, CV — the foundational autonomic-tone markers used in virtually every published HRV study.

Poincaré

SD1, SD2, and the SD1/SD2 ratio — a geometric fingerprint of short- vs long-term beat variability, and autonomic balance.

Frequency Domain

VLF, LF, HF power, nLF/nHF, and the LF/HF ratio — spectral power in the standard autonomic bands.

Geometric

HRV Triangular Index, TINN, and the Baevsky Stress Index — histogram-based measures that stay robust even with noisy beats.

Active Biofeedback · Free

It doesn't just measure your HRV. It helps you raise it.

The accelerometer picks up the tiny movement of your chest as you breathe. Combined with live heart rate and beat-to-beat intervals, that drives a 3D soundstage rendered around your head — best on headphones — turning measurement into a guided practice.

  • Resonance — the star of the show: a shimmer that rewards heart–breath synchrony, at 3 difficulty levels
  • 3D soundstage — every layer is placed at a depth and direction around you; breath-reactive scenes start close in front and open up with each inhale
  • Breath Shepherd — a guide tone that meets your breath, then slows it toward ~6/min
  • Heartbeat sonification — hear your own rhythm, beat by beat
  • 14 physiology-driven soundscapes — deep enough to be a standalone app, included free here
Person meditating with headphones and a Polar H10 chest strap, a translucent sphere of spatial sound waves around their head
Sleep & Respiratory

What happens to your heart while you're not watching.

Overnight sessions get their own analysis layer — cardiac and respiratory, computed from the same chest-strap data.

Nocturnal Cardiac Monitoring

Sleep-specific RMSSD, SDNN, SD2 and pNN50, plus nocturnal HR dipping % — the overnight drop expected in a healthy autonomic system.

Breathing Rate Estimation

Derived from accelerometer chest movement fused with ECG-derived respiration (EDR), with a live confidence score on the fusion quality.

Apnea-Hypopnea Index

Estimated AHI with severity classification — None / Mild / Moderate / Severe — from ECG-based airflow-limitation patterns.

Breath Cycles

Per-breath inhalation/exhalation duration and amplitude, exported for sleep and meditation sessions alike.

One ~£70 Sensor, Nothing Left On The Table

Squeezing every drop out of a single chest strap.

The Polar H10 was built to broadcast a heart-rate number to a running watch. Underneath that, it's also streaming raw 130Hz ECG and a 3-axis accelerometer — most apps never touch either. Your Rhythm Studio pulls all of it, in parallel, into one pipeline: the same strap feeding a live desktop chart, a phone HUD, and a background model, simultaneously.

That's what makes some of the more unusual metrics possible — like charting individual breaths. The accelerometer's chest movement is fused with ECG-derived respiration (EDR) to pull out each inhale and exhale as its own waveform, with duration, amplitude, and a live confidence score on the fusion quality — not just an averaged "breaths per minute."

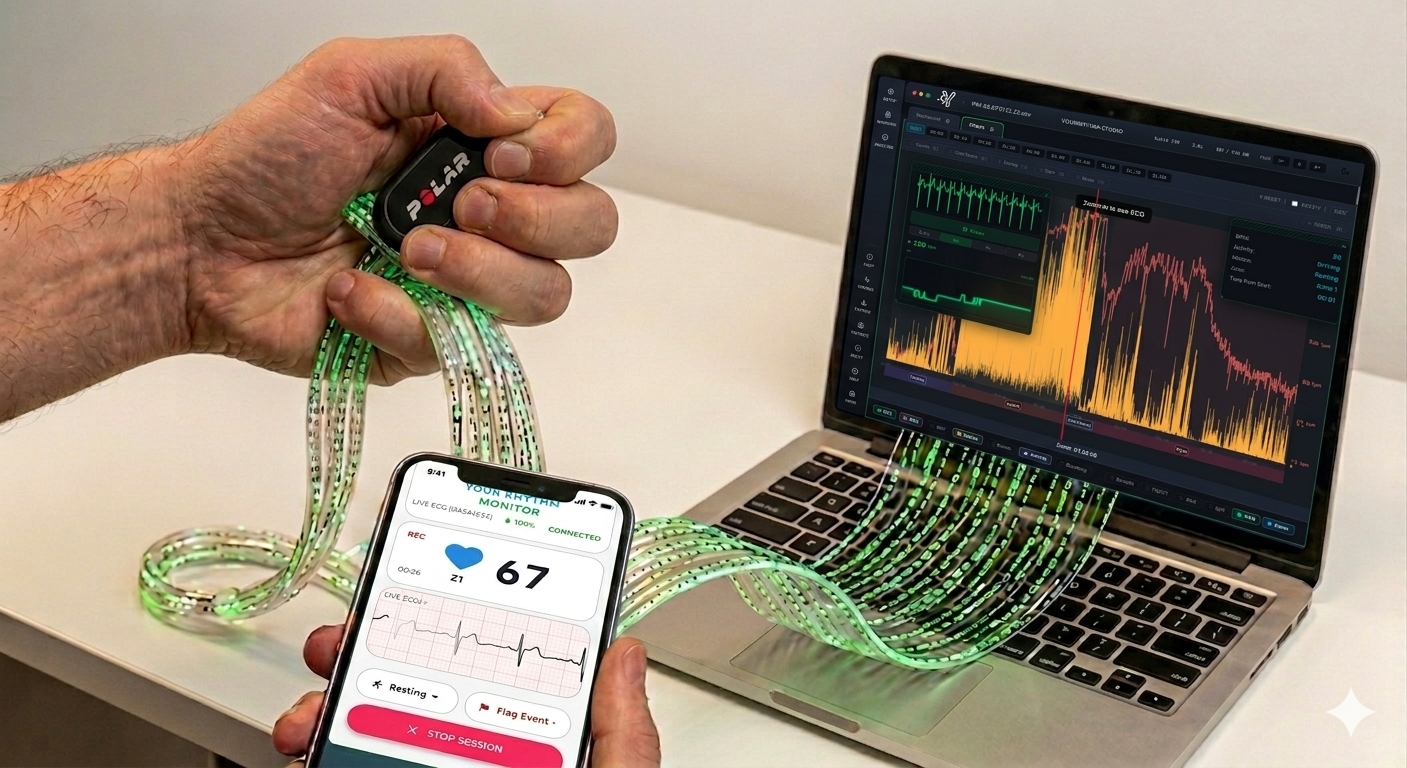
One sensor feeding a phone HUD and a live desktop ECG dashboard simultaneously
The Desktop Companion

Where all 99 health metrics actually live.

The phone app records and coaches in the moment. This is where every session gets dissected afterward — full ECG, PQRST annotation, and every trend line the phone doesn't have room to show.

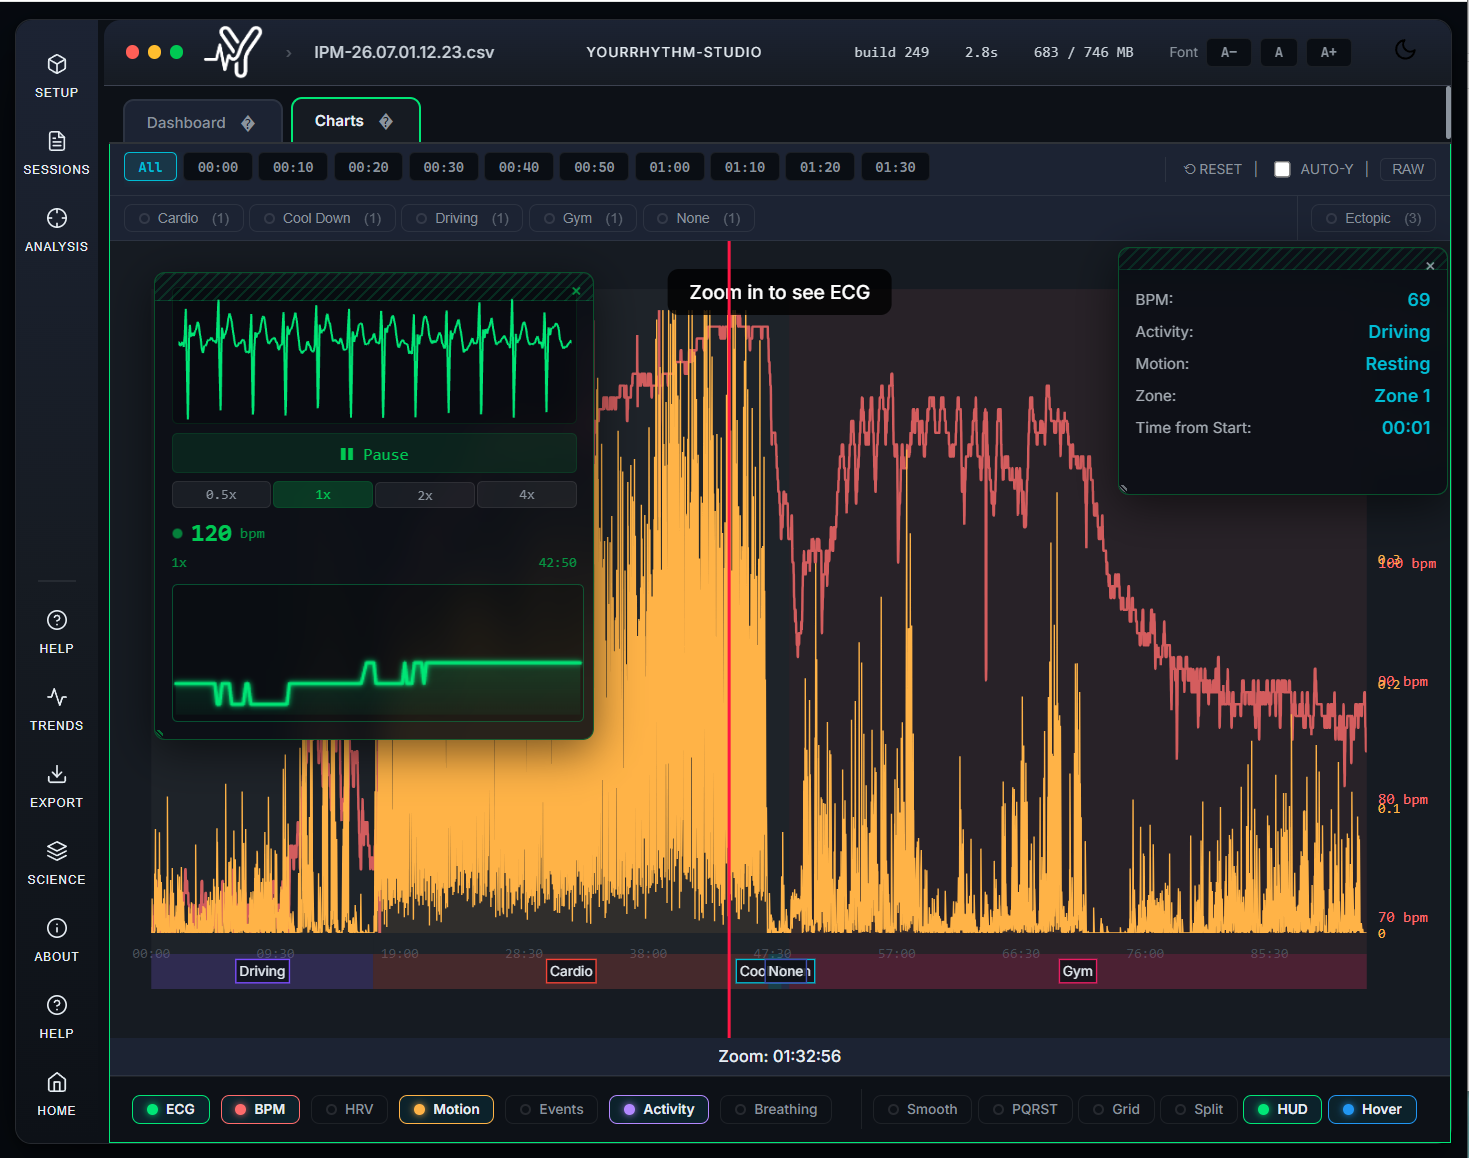
Charts tab: full-session ECG, BPM and activity overlay
Full-session overlay — ECG, BPM, motion, and activity zones on one zoomable timeline.
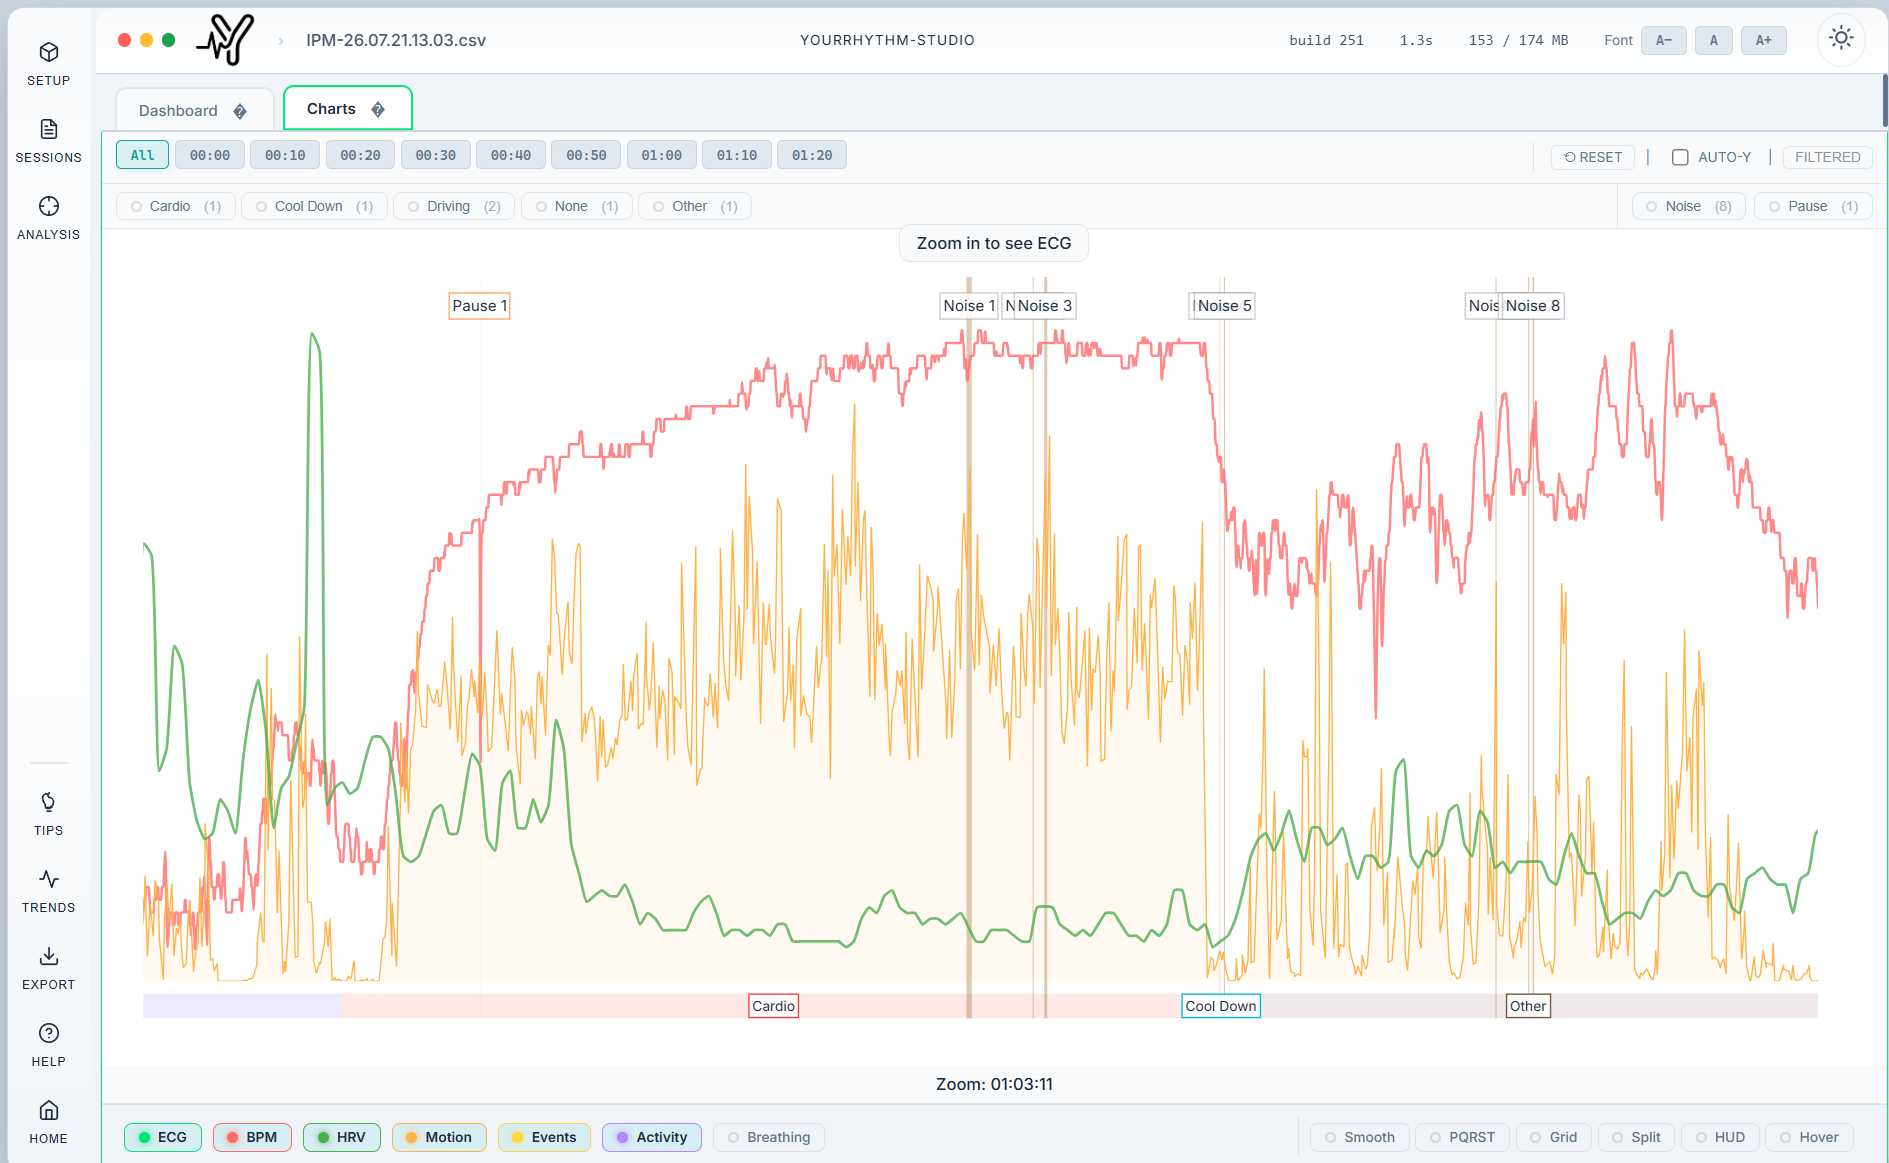
Charts tab: HR, HRV and breathing streams with detected noise events
HR, HRV and breathing streams, with auto-flagged noise and pause events.
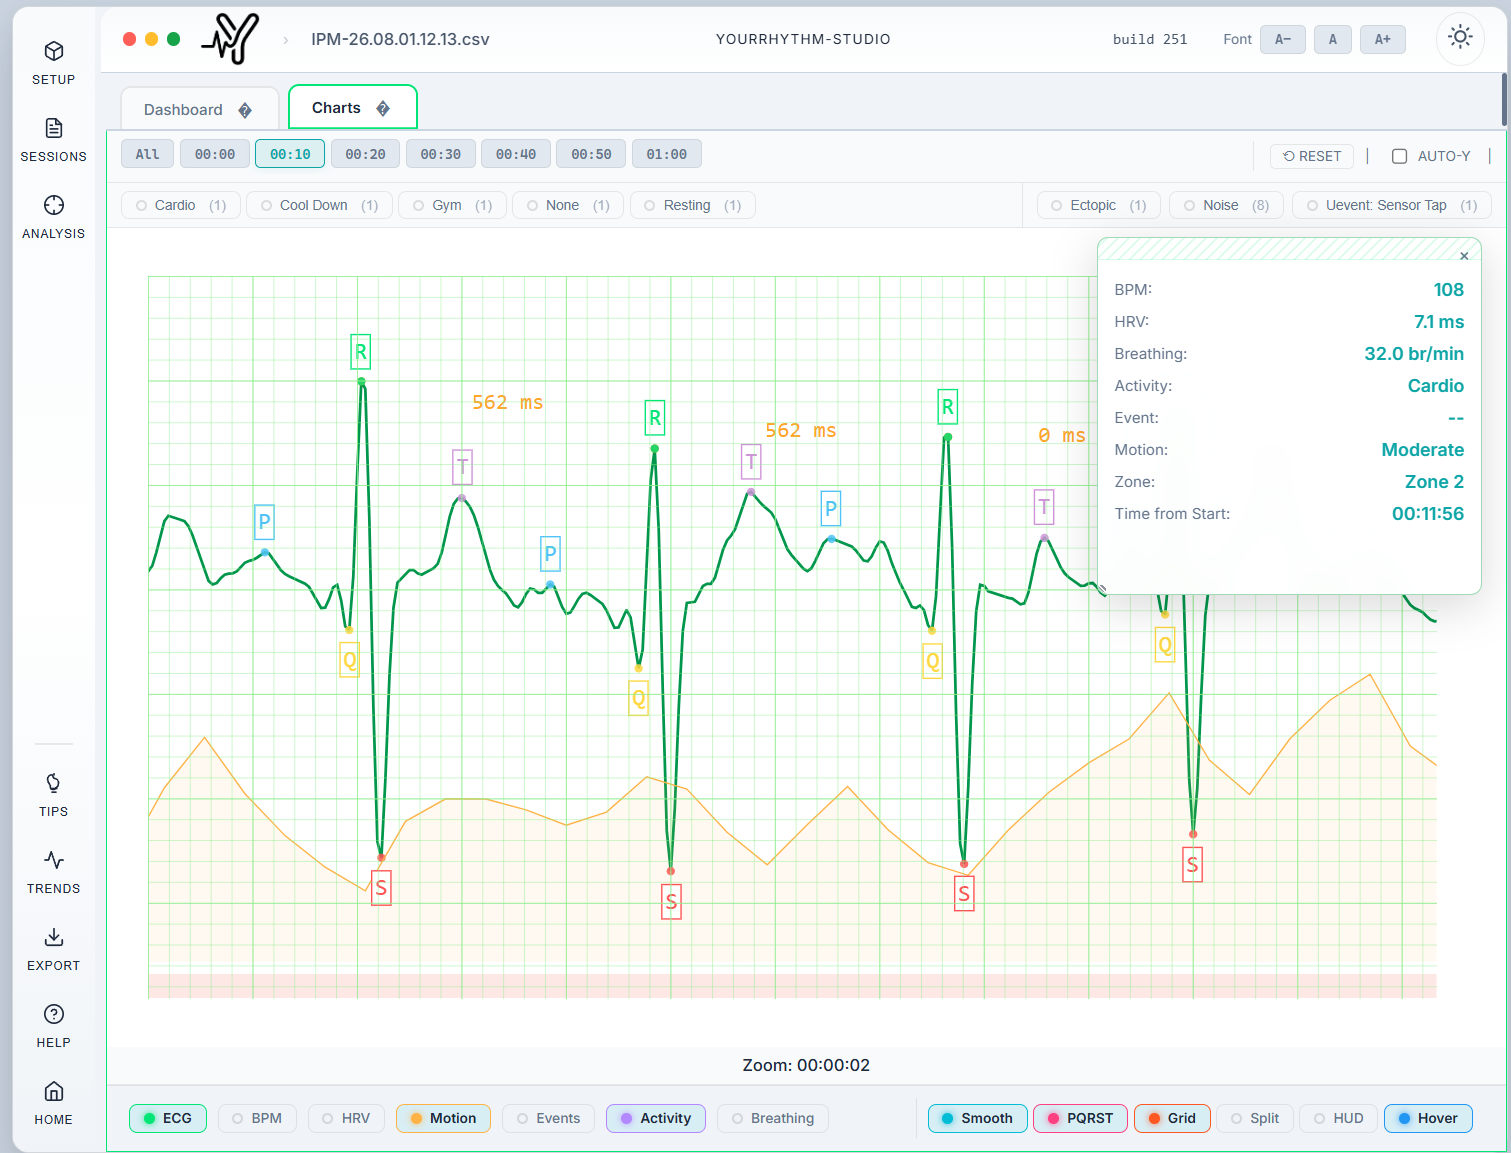
Zoomed ECG with PQRST wave annotation
Zoom to the individual beat — P, Q, R, S, T annotated automatically.
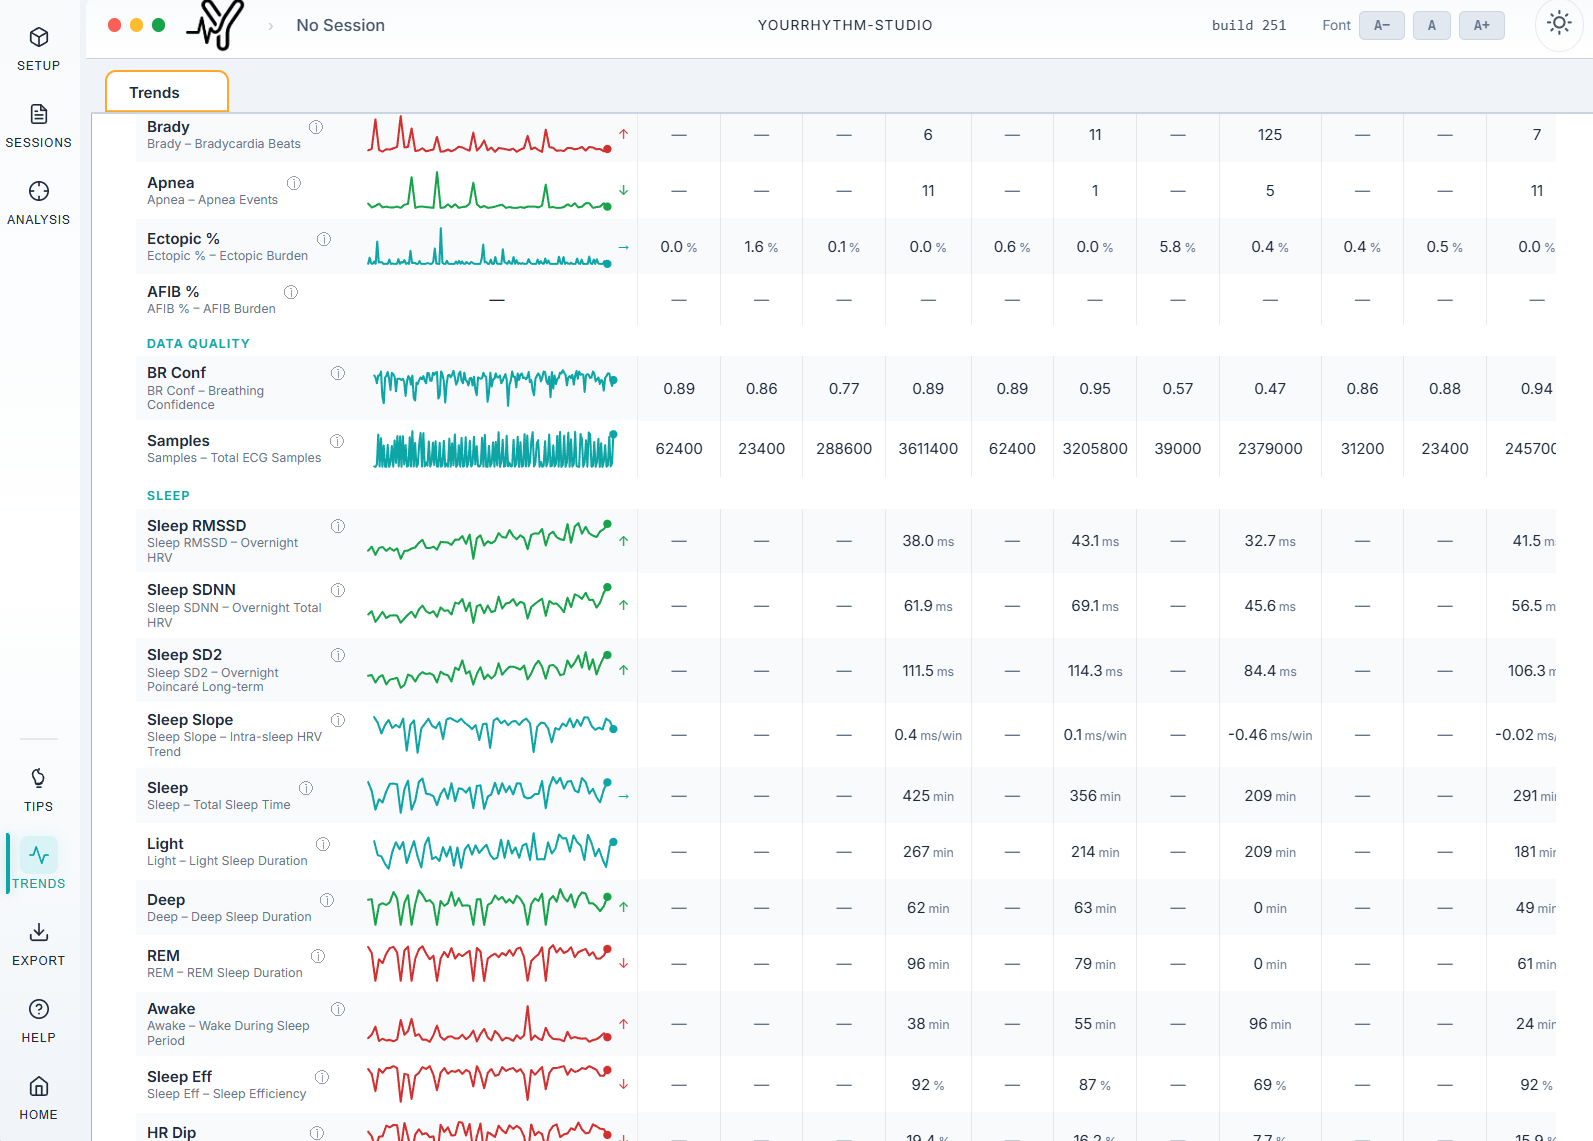
Trends table across sessions
Every metric, every session, side by side — so trends aren't just a memory.
Training Load & Trends

Not just a snapshot. A trajectory.

Every session feeds a longitudinal picture of how your cardiovascular fitness is actually moving.

TRIMP

Training Impulse — a single cardiac cost score for the session, weighted by intensity and duration.

ACWR

Acute:Chronic Workload Ratio — the same load-management metric elite training programs use to flag overtraining risk.

7-Day Trend Slopes

Linear regression on RHR, HRV and HRR across your last week of sessions — with direction, not just a number.

Data You Actually Own

No account. No cloud. No subscription. Ever.

What you'd expect to pay for elsewhereTypical costYour Rhythm Studio
Real-time arrhythmia alertsSubscription tierIncluded, free
HRV biofeedback / breathwork coachingSeparate app or subscriptionIncluded, free
Guided VO2max fitness testLab visit or premium smartwatchIncluded, free
99 graded health metrics with transparent methodologyRarely offered at any priceIncluded, free
Full desktop-grade analysis dashboardRecurring subscriptionOne-time · two cups of coffee
Raw data export (CSV, PDF)Often locked behind a subscriptionAlways included, always yours

The fine print: your health data is only ever transmitted over your own local Wi-Fi, to your own browser — or exported by you, to wherever you choose. Nothing is ever sent to us.

Fifteen years of doctors missed it. This would have caught it in a night.

No hype, no black boxes: every metric is science-based and described in full — about sixteen hours of documentation — because trust isn't claimed, it's shown. The most feature-rich monitor I could build. Practically free — £8 if you already own the strap.

Read the full story Get the free app